Integration point data investigation
The tool ipDataToPointCloud converts an input mesh with OGS’s integration
point data to a point cloud whose nodes are the integration points of the input
mesh.
Usage
ipDataToPointCloud -i <path> -o <path>
Example
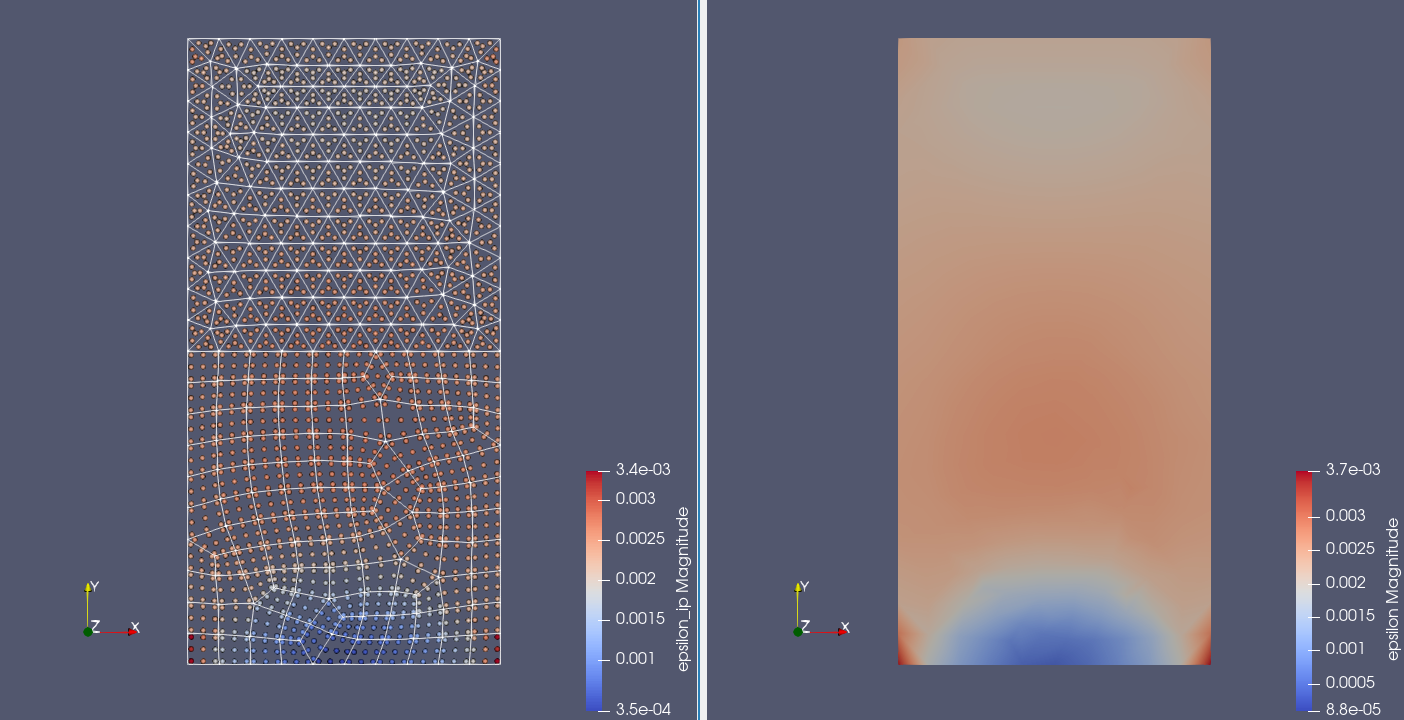
Invoking the tool on a mixed element test mesh we can create the following visualization in ParaView:

On the right we see the extrapolated strain magnitude (nodal data, epsilon)
visualized on the input mesh.
Due to extrapolation and averaging artefacts, this data can be distorted very
much. In this example it looks OK.
The input mesh also contains the corresponding integration point data (VTU field
data, epsilon_ip), which are the raw data used in OGS’s equation system
assembly without output related artefacts.
Unfortunately, ParaView and other tools do not have a good support for the
visualization of such field data.
In order to visualize the data and provide integration point coordinates, the
tool ipDataToPointCloud can be used.
Its result is visualized on the left (nodes) together with a wireframe
representation of the input mesh.
This article was written by Christoph Lehmann. If you are missing something or you find an error please let us know.
Generated with Hugo 0.122.0
in CI job 430699
|
Last revision: February 20, 2024
Commit: [App|PVTU2VTU] Faster computation of unique nodes and mapping d5e28bc
| Edit this page on