SimplePETSc
![]() This page is based on a Jupyter notebook.
This page is based on a Jupyter notebook.


The following shows running a simple steady-state diffusion benchmark running on 2 cores.
import os

prj_name = "square_1e1_neumann"
data_dir = os.environ.get("OGS_DATA_DIR", "../../../Data")
prj_file = f"{data_dir}/EllipticPETSc/{prj_name}.prj"

from pathlib import Path

out_dir = Path(os.environ.get("OGS_TESTRUNNER_OUT_DIR", "_out"))
if not out_dir.exists():
    out_dir.mkdir(parents=True)

print(f"mpirun -np 2 ogs {prj_file} > out.txt")
! mpirun -np 2 ogs {prj_file} > out.txt

from datetime import datetime

print(datetime.now())mpirun -np 2 ogs /var/lib/gitlab-runner/builds/vZ6vnZiU/1/ogs/ogs/Tests/Data/EllipticPETSc/square_1e1_neumann.prj > out.txt
2024-05-08 18:22:49.746696
import vtuIO
pvdfile = vtuIO.PVDIO(f"{prj_name}.pvd", dim=2)
time = pvdfile.timesteps
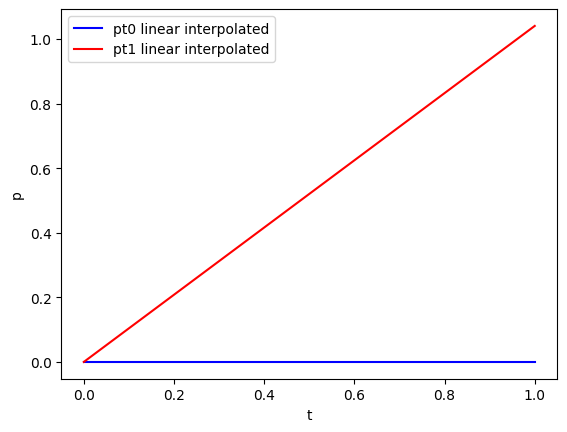
points = {"pt0": (0.3, 0.5, 0.0), "pt1": (0.24, 0.21, 0.0)}
pressure_linear = pvdfile.read_time_series("pressure", points)
import matplotlib.pyplot as plt
plt.plot(time, pressure_linear["pt0"], "b-", label="pt0 linear interpolated")
plt.plot(time, pressure_linear["pt1"], "r-", label="pt1 linear interpolated")
plt.legend()
plt.xlabel("t")
plt.ylabel("p")WARNING: Default interpolation backend changed to VTK. This might result in
slight changes of interpolated values if defaults are/were used.
Text(0, 0.5, 'p')
This article was written by Lars Bilke. If you are missing something or you find an error please let us know.
Generated with Hugo 0.122.0
in CI job 436167
|
Last revision: November 9, 2021