MeshMapping
Description
MeshMapping is a tool to change the elevation of the nodes of a 2D mesh according to a raster file (*.asc, *.grd, *.xyz) or another 2D mesh.
The x-y coordinates remain unchanged, while the z-coordinates of the input mesh are adjusted according to the raster used for mapping.
Usage
   MeshMapping  -i <string> -o <string> [-r <string>] [-m <string>]
                [-d <number>] [-s <number>] [--lowpass] [--] [--version] [-h]

Where:
     (required)  Input mesh file (*.vtu, *.msh)

   -o <string>,  --output <string>
     (required)  Output mesh file (*.vtu)

   -r <string>,  --raster <string>
     Raster file (*.asc *.grd *.xyz) to map the input file on.

   -m <string>,  --mesh <string>
     2D mesh file (*.vtu) to map the input file on.

   -d <number>,  --distance <number>
     Maximum distance to search for mesh nodes if there is no corresponding
     data for input mesh nodes on the mesh it should be mapped on. (Default
     value: 1)

   -s <number>,  --static <number>
     Static elevation to map the input file to. This can be combined with
     mapping based on rasters or other meshes to deal with locations where
     no corresponding data exists.

   --lowpass
     Applies a lowpass filter to elevation over connected nodes.

   --,  --ignore_rest
     Ignores the rest of the labeled arguments following this flag.

   --version
     Displays version information and exits.

   -h,  --help
Displays usage information and exits.Example
Mapping the input mesh to a digital elevation model (DEM).


Fig. 1 Both images show the INPUT mesh from two different point of views. The upper image shows the view along the z-axis. The lower image shows the view along the x-axis.
MeshMapping -i Berlin.vtu -o Berlin_mapped.vtu -r DEM.ascThe command above maps the mesh Berlin.vtu to the mesh Berlin_mapped.vtu according to the elevation given in DEM.asc.
Differences can be seen comparing Fig.1 and Fig.2, especially comparing the lower images.
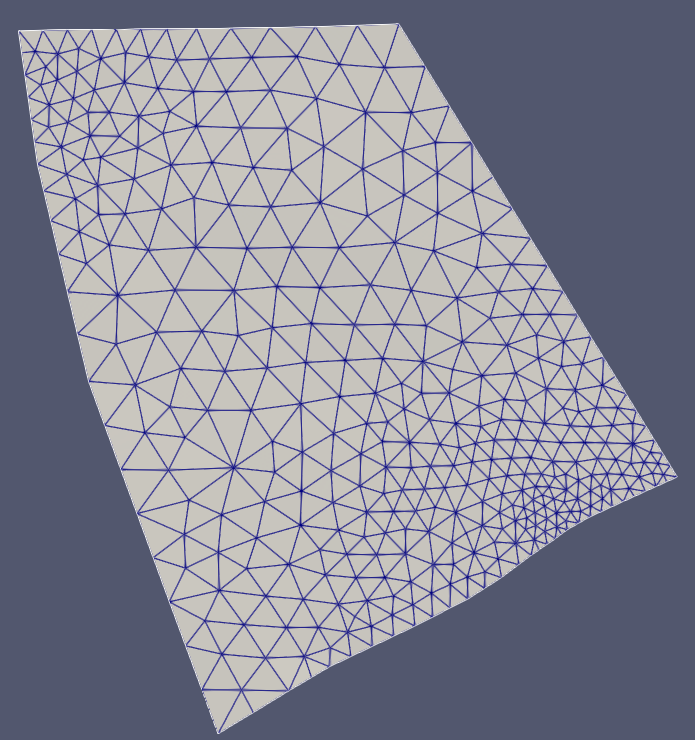
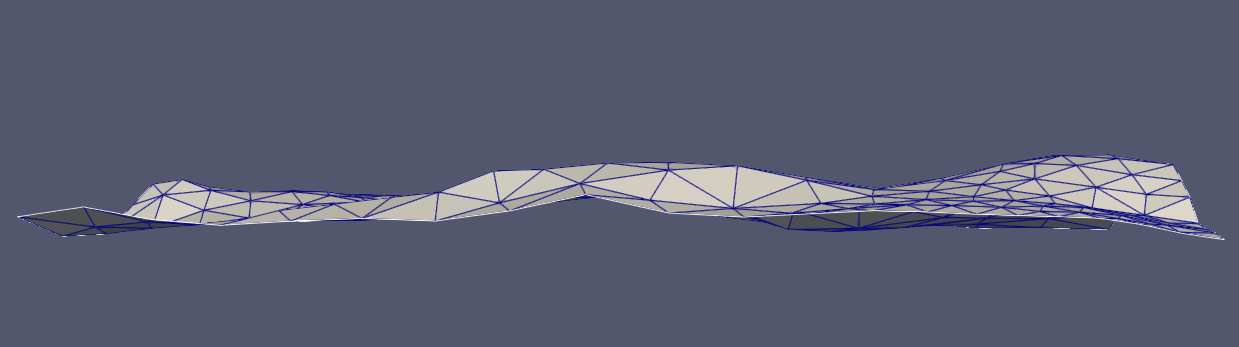
Fig. 2 Both images show the OUTPUT mesh from two different point of views. The upper image shows it viewing along the z-axis. The right image shows it viewing along the x-axis. To increase the visibility of the elevation, z-values are scaled by factor of 10.
This article was written by Julian Heinze. If you are missing something or you find an error please let us know.
Generated with Hugo 0.147.9
in CI job 577984
|
Last revision: May 22, 2025
Commit: Remove deprecated TES process 6477209a
| Edit this page on