LargeDeformations: Rigid Body Rotation
![]() This page is based on a Jupyter notebook.
This page is based on a Jupyter notebook.


 |
|---|
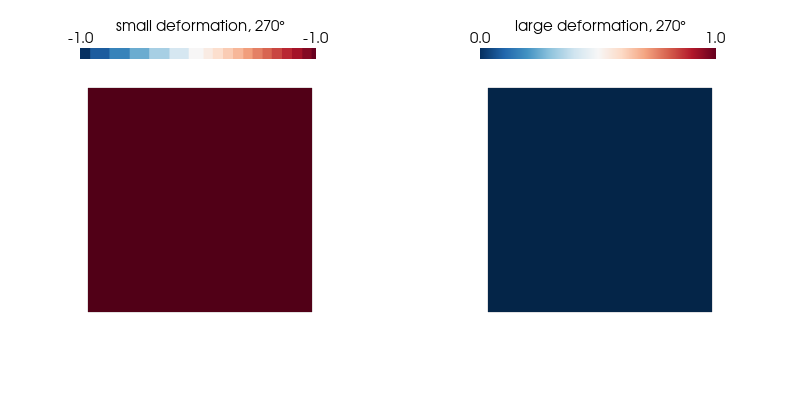
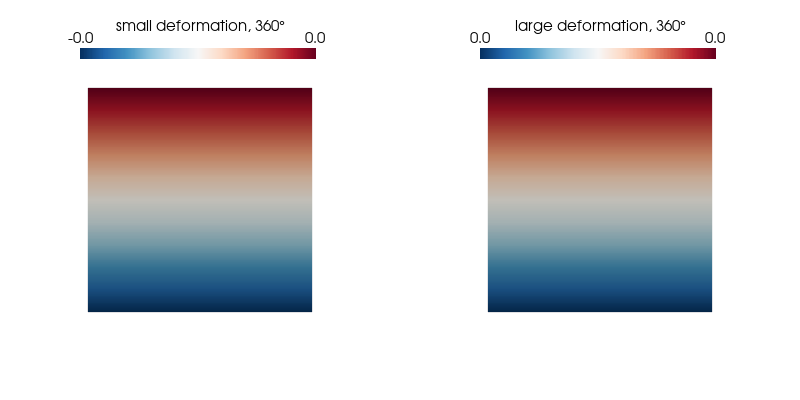
In this benchmark we test a basic kinematic feature of the finite strain / large deformations implementation in OpenGeoSys. An element is subjected to a rigid body rotation. The expected result is a stress- and strain-free motion. This is confirmed for the finite-strain implementation while the small-strain implementation shows phantom strains and stresses.
Basic definitions
The small deformation code uses the linearized strain tensor:
\begin{align} \boldsymbol{\epsilon} = \frac{1}{2} \left( \text{grad}, \mathbf{u} + \text{grad},^\text{T} \mathbf{u} \right) \end{align}
while the large deformation code is set up in a Total Lagrangian formulation and rests on Green-Lagrange strains:
\begin{align} \mathbf{E} = \frac{1}{2} \left( \text{Grad}, \mathbf{U} + \text{Grad}^\text{T} \mathbf{U} + \text{Grad}^\text{T} \mathbf{U},\text{Grad}, \mathbf{U}\right) \end{align}
A rigid body rotation in 2D can be described by
\begin{align} \mathbf{u} = [X_1 (\cos \vartheta - 1) - X_2 \sin \vartheta] \mathbf{E}_1 + [X_1 \sin \vartheta + X_2 (\cos \vartheta - 1)]\mathbf{E}_2 \end{align}
While this yields $\mathbf{E} = \mathbf{0}$ in finite deformation kinematics, we obtain a linearized strain tensor coordinate matrix with
\begin{align} [\boldsymbol{\epsilon}]_{ij} = \left( \begin{array}{cc} \cos \vartheta - 1 & 0 \ 0 & \cos \vartheta - 1 \end{array} \right) \end{align}
For both cases the OGS’s linear elastic model is used to compute stresses. In the TL formulation this amounts to a Saint-Venant-Kirchhoff model. It thus suffices to illustrate the behaviour of strain values.
Click to toggle input cell
# HIDDEN
import numpy as np
import matplotlib.pyplot as plt
from matplotlib import cm
from ogs6py import ogs
import os
import pyvista as pv

# Some plot settings
plt.style.use("seaborn-v0_8-deep")
plt.rcParams["lines.linewidth"] = 2.0
plt.rcParams["lines.color"] = "black"
plt.rcParams["legend.frameon"] = True
plt.rcParams["font.family"] = "serif"
plt.rcParams["legend.fontsize"] = 14
plt.rcParams["font.size"] = 14
plt.rcParams["axes.spines.right"] = False
plt.rcParams["axes.spines.top"] = False
plt.rcParams["axes.spines.left"] = True
plt.rcParams["axes.spines.bottom"] = True
plt.rcParams["axes.axisbelow"] = True
plt.rcParams["figure.figsize"] = (8, 6)Click to toggle input cell
from pathlib import Path

out_dir = Path(os.environ.get("OGS_TESTRUNNER_OUT_DIR", "_out"))
if not out_dir.exists():
out_dir.mkdir(parents=True)Click to toggle input cell
model_s = ogs.OGS(INPUT_FILE="square_1e0.prj", PROJECT_FILE=f"{out_dir}/square_1e0_small.prj")
model = ogs.OGS(PROJECT_FILE="square_1e0.prj")Click to toggle input cell
model_s.replace_text("SMALL_DEFORMATION", xpath="./processes/process/type")
model_s.replace_text("StandardElasticityBrick", xpath="./processes/process/constitutive_relation/behaviour")
model_s.replace_text("square_1e0_small", xpath="./time_loop/output/prefix")
model_s.remove_element(xpath="./processes/process/secondary_variables/secondary_variable[@internal_name='deformation_gradient']")
model_s.remove_element(xpath="./processes/process/secondary_variables/secondary_variable[@internal_name='volume_ratio']")
model_s.remove_element(xpath=".//vtkdiff[field='deformation_gradient']")
model_s.remove_element(xpath=".//vtkdiff[field='volume_ratio']")
model_s.write_input()True
Click to toggle input cell
model.run_model(logfile=f"{out_dir}/out.txt", args=f"-o {out_dir}")
model_s.run_model(logfile=f"{out_dir}/out.txt", args=f"-o {out_dir} -m .")OGS finished with project file square_1e0.prj.
Execution took 0.20206856727600098 s
Project file written to output.
OGS finished with project file /var/lib/gitlab-runner/builds/e3EQ9HiK/0/ogs/build/release-all/Tests/Data/LargeDeformation/RigidBody/RigidBody/square_1e0_small.prj.
Execution took 0.2133469581604004 s
Project file written to output.
Click to toggle input cell
pv.set_plot_theme("document")
pv.set_jupyter_backend("static") # comment out for interactive graphicsClick to toggle input cell
reader = pv.get_reader(f"{out_dir}/square_1e0.pvd")
reader_s = pv.get_reader(f"{out_dir}/square_1e0_small.pvd")Click to toggle input cell
reader.set_active_time_value(0.0)
reader_s.set_active_time_value(0.0)
mesh = reader.read()[0]  # nulltes Gitter lesen
mesh_s = reader_s.read()[0] # nulltes Gitter lesenpoints = mesh.point_data["epsilon"].shape[0]Click to toggle input cell
xs = mesh.points[:, 0]
ys = mesh.points[:, 1]Click to toggle input cell
def ploteps(time, angle, quantity="epsilon"):
reader.set_active_time_value(time)
reader_s.set_active_time_value(time)
mesh = reader.read()[0] # nulltes Gitter lesen
mesh_s = reader_s.read()[0] # nulltes Gitter lesen
eps_vec = mesh.point_data[quantity][:, 0]
eps_vec_s = mesh_s.point_data[quantity][:, 0]
print(
"Expected: %.2f (small strain) and 0 (large strain)"
% (np.cos(np.deg2rad(angle)) - 1)
)
sargs = dict(
title="small deformation, " + str(angle) + "°",
title_font_size=15,
label_font_size=15,
n_labels=2,
position_x=0.2,
position_y=0.85,
fmt="%.1f",
width=0.6,
)
p = pv.Plotter(shape=(1, 2), border=False)
p.subplot(0, 0)
p.add_mesh(
mesh,
scalars=eps_vec_s,
show_edges=False,
show_scalar_bar=True,
colormap="RdBu_r",
scalar_bar_args=sargs,
)
# p.show_bounds(ticks="outside", xlabel="", ylabel="")
# p.add_axes()
p.view_xy()
p.camera.zoom(1.2)
sargs1 = dict(
title="large deformation, " + str(angle) + "°",
title_font_size=15,
label_font_size=15,
n_labels=2,
position_x=0.2,
position_y=0.85,
fmt="%.1f",
width=0.6,
)
p.subplot(0, 1)
p.add_mesh(
mesh,
scalars=eps_vec,
show_edges=False,
show_scalar_bar=True,
colormap="RdBu_r",
scalar_bar_args=sargs1,
)
# p.show_bounds(ticks="outside", xlabel="", ylabel="")
# p.add_axes()
p.view_xy()
p.camera.zoom(1.2)
p.window_size = [800, 400]
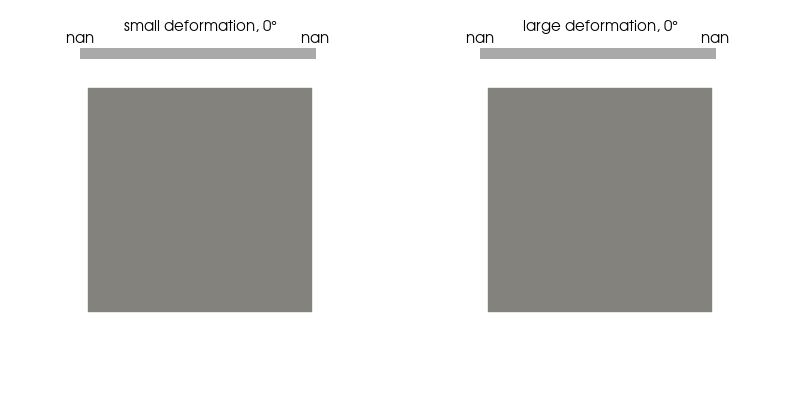
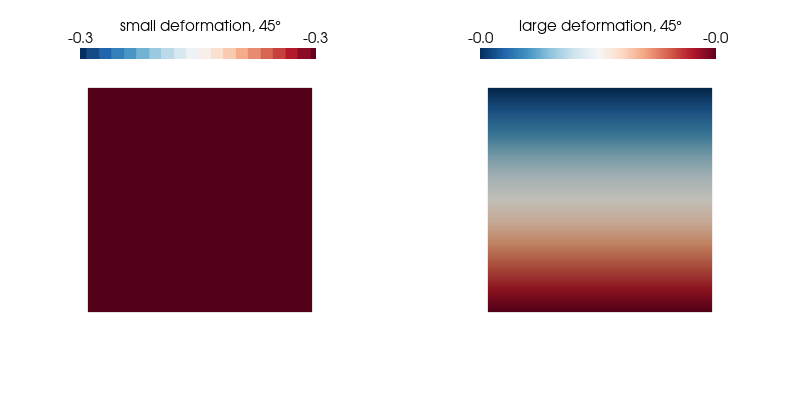
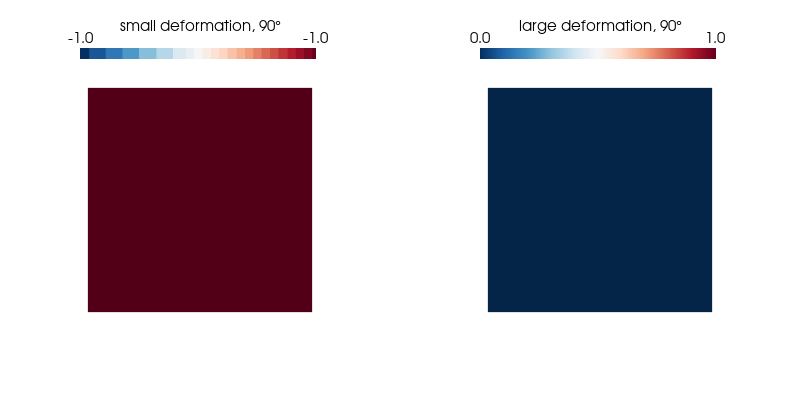
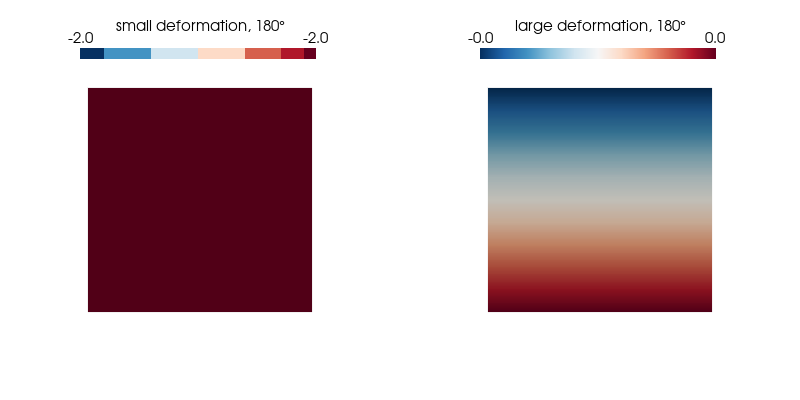
p.show();We plot the normal strain in the $x$-direction for both kinematic formulations on the undeformed configuration as it undergoes a 360° rotation and find our expectations confirmed.
ploteps(0, 0)Expected: 0.00 (small strain) and 0 (large strain)
/var/lib/gitlab-runner/builds/e3EQ9HiK/0/ogs/build/release-all/.venv/lib/python3.11/site-packages/pyvista/plotting/mapper.py:670: RuntimeWarning: All-NaN axis encountered
  clim = [np.nanmin(scalars), np.nanmax(scalars)]
ploteps(0.5, 45)Expected: -0.29 (small strain) and 0 (large strain)
ploteps(1, 90)Expected: -1.00 (small strain) and 0 (large strain)
ploteps(2, 180)Expected: -2.00 (small strain) and 0 (large strain)
ploteps(3, 270)Expected: -1.00 (small strain) and 0 (large strain)
ploteps(4, 360)Expected: 0.00 (small strain) and 0 (large strain)
This article was written by Thomas Nagel. If you are missing something or you find an error please let us know.
Generated with Hugo 0.122.0
in CI job 436167
|
Last revision: March 1, 2023