Unsaturated Mass Transport
Overview
The Richards equation is often used to describe water movement in the unsaturated zone, while the mass transport equation describes solute movement in the liquid phase. Here, we use a monolithic approach to simulate mass transport in an unsaturated medium.
The development of the equation system is given in this PDF. In the following, we present a numerical benchmark that uses experimental data as reference.
Problem description
We use the Padilla et al. (1999) problem which features a series of saturated and unsaturated laboratory column experiments to validate the implementation. In specific, we refer to experiments “NaCl1” (saturated flow) and “NaCl6” (unsaturated flow) - see also table 1 in Padilla et al. (1999) - and use the following parameters as model input.
Model setup
We use a 1D domain with $0 < x < 0.25 m$, and a spatial resolution of $1.25 mm$ with a total of 200 elements. Top boundary conditions are concentration $c = 1$ (as Dirichlet) for both setups, and a specific flux $q_{NaCl1} = 2.12789E-05$ and $q_{NaCl6} = 6.46004E-06$ (as Neumann) for saturated and unsaturated cases, respectively. Bottom boundary conditions are a free exit boundary for mass transport, and Dirichlet pressure values are chosen so that the saturation in the column follows the respective values according to table 1 in Padilla et al. (1999) as $p_{NaCl1} = 0 Pa$ and $p_{NaCl6} = -4800 Pa$.
Saturated intrinsic permeability is calculated from given flux and pressure gradient information as $\kappa = 1.174E-10 m^2 $; total porosity is $\theta = 0.45$; van-Genuchten-values are $m = 0.789$ (from $n = 4.74$ via $m = 1-1/n$), bubbling pressure $p_d = 3633.33 Pa$ (from $\alpha = 0.027 cm^{-1}$ via $p_c = \rho \cdot g / \alpha$), residual saturation $s_r = 0.1689$. Molecular diffusion coefficient was set to $D_m = 1e-9 m^2/s$; dispersivities were chosen from table 2 in Padilla et al. (1999) and set to $\alpha_{NaCl1} = 3.4173E-04 m$ and $\alpha_{NaCl6} = 4.6916E-03 m$ for saturated and unsaturated conditions, respectively.
Initial conditions are $c = 0$ and hydrostatic pressure conditions with steady state flow for both scenarios.
The NaCl1 project file The NaCl6 project file
Results
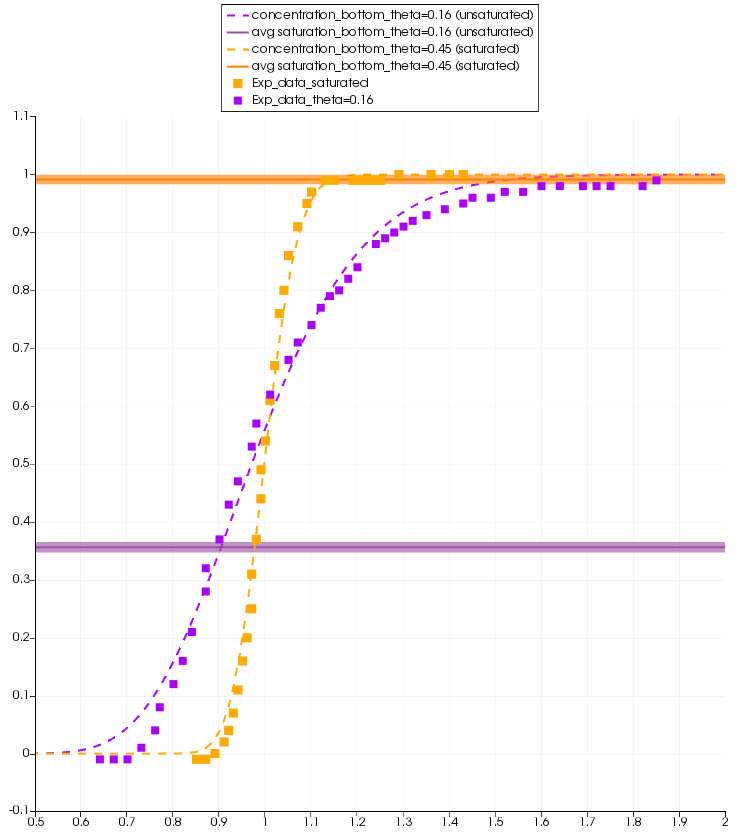
The figure below shows breakthrough curves vs experimental result at the bottom of the simulation domain, together with averaged saturation values at the two observation points with distance of 0.075 cm from both ends of the column (as stated in Padilla et al., 1999) over pore volume.

Comparison between numerical (lines) and experimental (squares) results for cases 'NaCl1' and 'NaCl6' from Padilla et al. (1999).
It can be seen, that with decreasing saturation, breakthrough curves exhibit stronger dispersion through the decreased angle of the breakthrough curve. Both simulation results follow the experimental observations closely; deviations, especially in the unsaturated case, can be attributed to known tailing effects from secondary porosity.
Here is the ParaView state file for comparison.
References
Padilla, I. Y., T.-C. J. Yeh, and M. H. Conklin (1999), The effect of water content on solute transport in unsaturated porous media, Water Resour. Res., 35(11), 3303–3313, doi:10.1029/1999WR900171.
This article was written by Marc Walther. If you are missing something or you find an error please let us know.
Generated with Hugo 0.122.0
in CI job 449919
|
Last revision: April 23, 2024
Commit: [PL/LD] Use generic cell average output 3557e29
| Edit this page on