Theis solution for well pumping
Overview
Abstraction of water from an aquifer is a common procedure, as groundwater is usually better protected from contamination and steadily available even in dry seasons. For a sustainable water usage, the evaluation of the spatio-temporal behaviour of the water level for a specified abstraction rate is of high importance for water management.
This benchmark verifies the groundwater level drawdown for an aquifer that is subjected to pumping.
Problem description
For pumping from a well, Theis (1935) proposed an analytical solution to calculate the water level drawdown over time and distance from the well. A short summary of the solution can be seen in
web/content/docs/benchmarks/liquid-flow/liquid-flow-theis-problem.md
Here, we verify pumping abstraction with Theis for the ComponentTransport process using a 3D setup. The setup is adapted from Walther et al. (2014), section 3.2.
Model setup
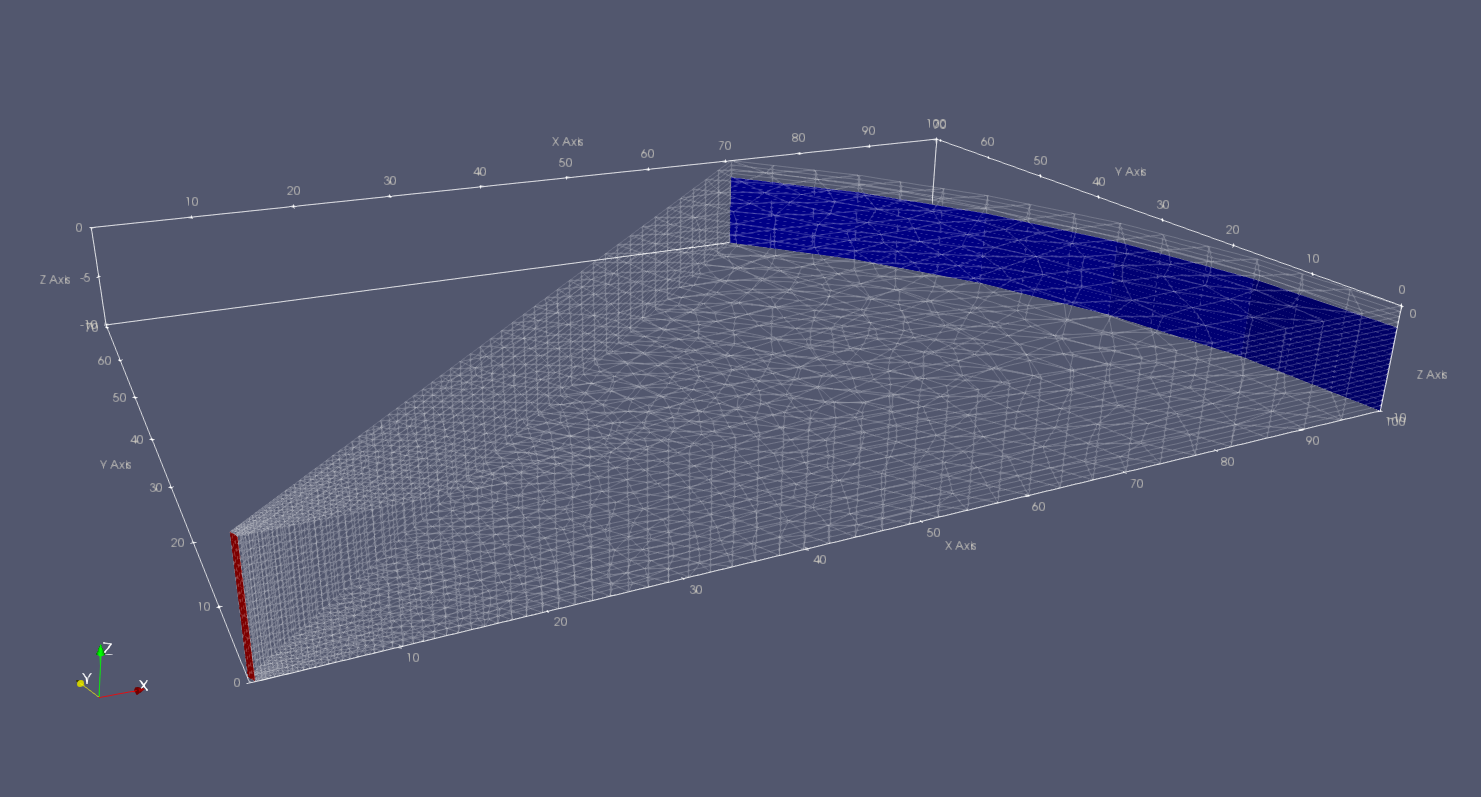
The setup comprises a 1/8th slice of a full circle (see figure 1).

Mesh and boundary conditions (BC); blue = outer Dirichlet pressure and concentration BC, red = inner Neumann abstraction BC.
The outer boundary condition is set as Dirichlet with a hydrostatic pressure along the shell surface of the slice equivalent to a head of $h = 0 m$ (i.e. water level equals top of domain). For mass transport, a Dirichlet boundary conditions with concentration $c = 0$ is set at the outer shell. The inner boundary condition is equivalent to the eighth of a total abstraction rate of $Q_t = 15 m^3/d$ for a full cylinder. NB: In the ComponentTransport process, the Neumann BC is given as mass flux and has to be calculated per area, such that the value for the project file is $Q = Q_t / 8 / A \cdot \rho_0 = 2.83542E-03 m^3/s/m^2 \cdot kg/m^3$ (units equal $\frac{kg}{s m^2}$) with fluid reference density $\rho_0 = 1000 kg/m^3$ and abstraction area $A = 7.65 m^2$.
The homogeneous, isotropic domain is defined for the radius $1 < r < 100 m$ and a thickness $b = 10 m$. Saturated intrinsic permeability is $\kappa = 7.6453E-13 m^2$ yielding a transmissivity of $T = 7.5E-05 m^2/s$; porosity is $\phi = 0.2$; specific storage is $S_s = 1.0E-03$ and defined through compressibility $\gamma = 5.0968E-08 s^2/m/kg$ (input tag fluid_density_pressure_difference_ratio is $\gamma = \frac{1}{\rho_0} \frac{\partial \rho}{\partial p}$, which can be used to incorporate $S_s$ with $\gamma = \frac{S_s}{b \phi g \rho_0}$ with gravitational acceleration $g = 9.81 m^2/s$).
Mass transport properties are irrelevant as no transport processes are calculated.
Initial conditions are $c = 0$ and hydrostatic pressure conditions.
Results
The figure below compares the analytical Theis solution vs. the simulated values from OGS.

Comparison between numerical (crosses) and analytical (lines) values.
The top figure shows drawdown (i.e. the difference in water level compared to an initial state) over time at distance $r = 30 m$: for a simulation time $t < 40000 s$, the differences between analytical and numerical solutions are marginal; at later simulation times, the drawdown shows lower values than predicted from the analytical solution, as it is influenced by the outer Dirichlet pressure boundary condition.
The lower figure shows drawdown over radius at time $t = 5000 s$; the top figure also signifies this with a green vertical: over the whole domain, the analytical and numerical solutions are coinciding very well. NB: With higher values of $S_s$, one has to take care to convert the simulated water level to equivalent freshwater head; in this case, fluid density variation is very low such that a conversion is not required.
References
Theis, C.V., 1935. The relation between the lowering of the piezometric surface and the rate and duration of discharge of a well using groundwater storage. Trans. Amer. Geophys. Union 16, 513–514.
Walther, M., 2014. Variable-Density Flow Processes in Porous Media On Small, Medium and Regional Scales (Dissertation). Technische Universität Dresden.
This article was written by Marc Walther. If you are missing something or you find an error please let us know.
Generated with Hugo 0.147.9
in CI job 577984
|
Last revision: May 22, 2025
Commit: Remove deprecated TES process 6477209a
| Edit this page on