Constant viscosity
Hydro-thermal process
For more details on the hydro-thermal process and its implementation in OpenGeoSys, please see hydro-thermal process page in Processes .
Problem description
This is a 2d benchmark of large-scale thermal convection that tests the temperature and pressure dependent fluid density in the hydro-thermal process monolithic approach implementation. It is defined on the domain $\Omega = [0,5500]^2.$ The fluid density is a Linear model with a temperature slope of $-4.3\cdot 10^{-4}\ \mathrm{K}^{-1}$ and a pressure slope of $0.5\cdot 10^{-9}\ \mathrm{Pa}^{-1}$ about a reference density of $1000\ \mathrm{kg}/\mathrm{m}^3$.
- The initial conditions for the pressure is a gradient starting from zero at the top surface to a pressure of circa 54 mega pascal at the bottom given in the data array
initial_pressurein the VTU file. The initial temperature is also almost a gradient from top (293 K) to bottom (443 K) of the domain, except there is a small perturbation given by adding $\sin \left( \pi \frac{y}{5500}\right) \cdot \cos \left( \pi \frac{x}{5500}\right).$ See the following images.
TODO 3 images
- For the pressure we set at the top left point of $\Omega$ a Dirichlet-type boundary condition with a value of zero. On the top of $\Omega$ the temperature is fixed to 293 K (20 degree C), at the bottom of $\Omega$ the temperature is set to 443 K (170 degree C) via Dirichlet-type boundary conditions.
- The further parameter specification can be found in the project file linked at the top of this page.
- The steady state temperature is shown in the following on the right figure. The left figure shows the resulting temperature minus the initial gradient. With the temperature-only density model these temperatures were in good accordance with the FEFLOW results and with results from the OGS version < 6; see the note below the figure for the effect of the pressure dependence.
Comparison with FEFLOW solution
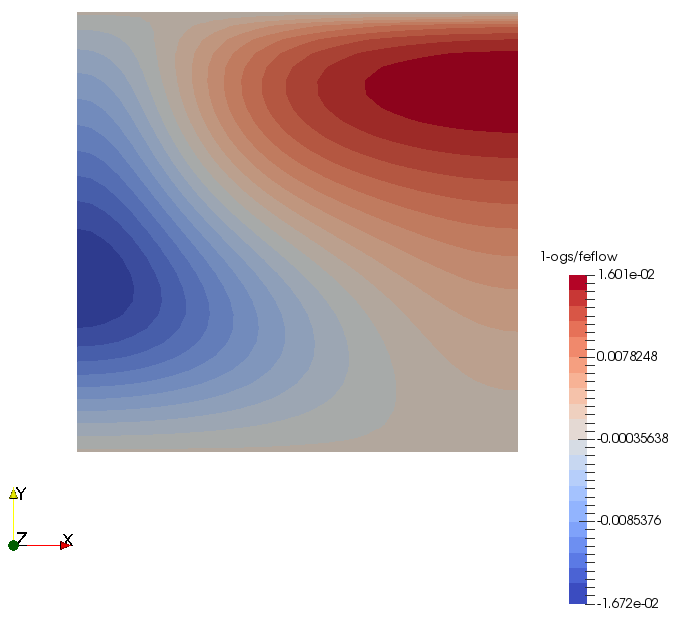
The figure was produced with a temperature-only fluid density model. The pressure dependence added afterwards changes the results, so the figure has not been regenerated and is shown for qualitative comparison only.
 Community Discussion
The following comments are pulled in from our Discourse forum and contain community-generated content.
This article was written by Thomas Fischer. If you are missing something or you find an error please reach out
to us on our forum.
Generated with Hugo 0.164.0
in CI job 825193
|
Last revision: July 22, 2026
Commit: refactor(HT#CTest): Added pressure dependent part to the benchmark 25f0011e2
| Edit this page on